1
2
3
4
5
6
7
8
9
10
11
12
13
14
15
16
17
18
19
20
21
22
23
24
25
26
| #-*- coding: utf-8 -*-
import numpy.matlib
import matplotlib.pyplot as plt
from pylab import *
def DrawData(xdata,ydata,style,tlabel):
plt.plot(xdata,ydata,style,label = tlabel)
plt.plot(xdata,ydata)
#=======User Data
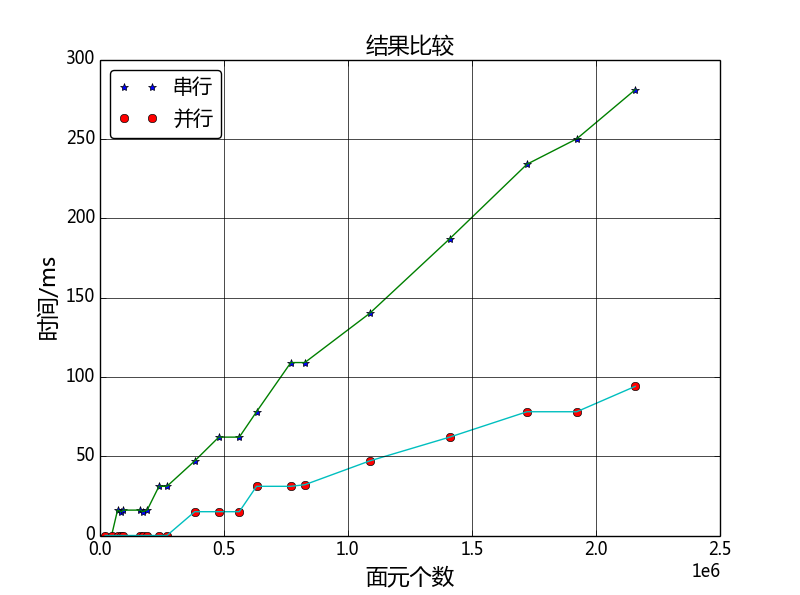
xpanelNum =[20524,46678,70734,85420,94588,161162,171896,190154,237754,269948,381950,478990,561684,631228,769506,825830,1087336,1409970,1721682,1922332,2158232]
ySerial = [0,0,16,15,16,16,15,16,31,31,47,62,62,78,109,109,140,187,234,250,281]
yParallel = [0,0,0,0,0,0,0,0,0,0,15,15,15,31,31,32,47,62,78,78,94]
DrawData(xpanelNum,ySerial,'*',u"串行")
DrawData(xpanelNum,yParallel,'o',u"并行")
#======Whole Figure
plt.title(u"结果比较",fontsize=16)
plt.ylabel(u"时间/ms",fontsize=16)
plt.xlabel(u"面元个数",fontsize=16)
plt.ticklabel_format(style='sci',axis='x',scilimits=(0,0))
plt.legend(fancybox = True,loc=0)
plt.grid(linestyle="-")
plt.show()
|

